Global stock averages have been captured by an extremely volatile environment for both shorter-term traders and long-term investors since 2019, with the focus last year very much on the trade dispute between the United States and China.
However, the ink was barely dry on the “phase one” trade deal between these nations when the world changed dramatically with the February outbreak of the coronavirus in China, and the international spread in March for a global pandemic to be declared.
As the virus spread into Europe and then the U.S., global financial markets shifted aggressively to a “risk-off” phase, with global stock markets experiencing violent bear market sell-offs, surrendering multiyear support levels.
From a technical analysis perspective, global stock indexes in March wiped out critical long-term support factors pertaining to the entire multiyear rallies since the conclusion of the global financial crisis bear markets, that have driven many stock indexes to all-time highs.
In the following charts, it can be seen that chart, trend line and retracement support levels from the multiyear bull trends have been breached, which signals potential for a more negative theme for global stock markets for the second half of 2020 and possibly into 2021. In this article we have used futures contracts, derivative products of the underlying cash indexes. This is because they are effectively open 24 hours and, therefore, fully convey the true price action during these turbulent times.
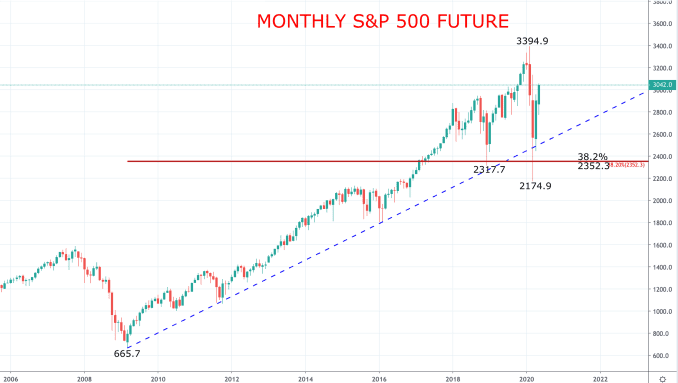
During the March 2020 bear plunge, the S&P 500 future reversed below the bull trend line from the global financial crisis low of 2009, surrendered the 38.2% Fibonacci retracement from the entire 2009-2020 bull rally, at 2,352.3 points and the swing low from the late 2018 spike lower, at 2,317.7. Fibonacci retracement levels are used by technical analysts to indicate possible locations of support and resistance for stock markets and are named after a popular mathematical sequence.
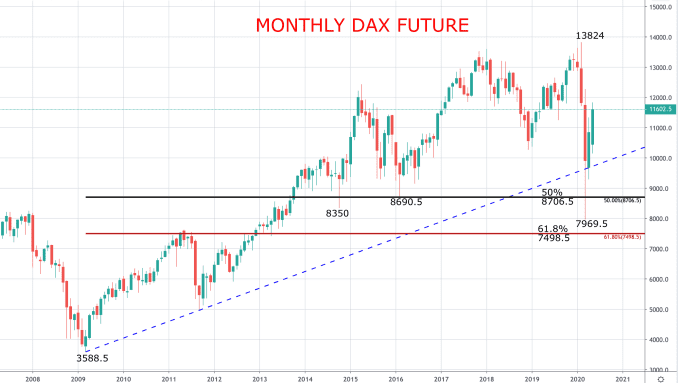
The German DAX future also surrendered key long-term supports during the March bear acceleration; also below the uptrend line from the 2009 global financial crisis low, the 50% Fibonacci retracement from the whole 2009-2020 bull rally, at 8,060.5, just holding above the 618% level at 7,498.5, plus through the key swing lows from 2016 and 2014, at 8,690.5 and 8,350 respectively. The March 2020 bear move low saw the DAX at its lowest level since 2013.
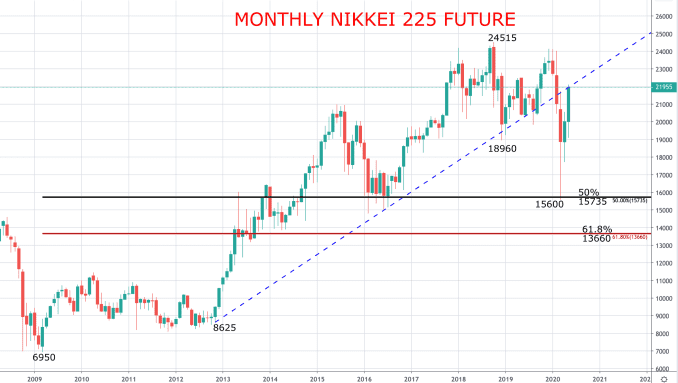
The Japanese Nikkei 225 future also reversed below key long-term supports in March 2020, through the bull trend line from the 2012 low, the 50% Fibonacci retracement from the whole 2009-2020 bull move, at 15,735, putting the Nikkei at its lowest level since 2016 in March this year.
The reaction from the authorities, global central banks and national governments was swift and aggressive in March and April, even when measured against the response to the global financial crisis. It could be argued that the extremely low interest rate environment, quantitative easing and the expansion of central bank balance sheets, alongside the fiscal policy measures from governments to keep national economies still just functioning during lockdowns, is the largest economic stimulus package seen since the Marshall Plan after World War II and prior to that, Franklin D. Roosevelt’s New Deal.
This extremely accommodative monetary and fiscal policy has allowed for global stock indexes to stage aggressive rebounds in March and April, followed by a consolidation phase into May. Latter May, however, also saw upside breakouts from these consolidation ranges, for a renewal of the bullish moves seen since March.
The late May bull breakouts now heightens the prospects for global stock averages to push back toward significant retracement and chart resistance levels pertaining to the first-quarter bear markets. In fact, the tech-heavy Nasdaq 100index is already close to its record high from the first quarter of 2020, driven by the strong performance during the rebound phase from March by the FAANG stocks (Facebook, Amazon, Apple, Netflix and Google).
The S&P 500 future is above the 61.8% retracement of the February-March bear market at 2,828.9, having closed the March runaway bear gap (2,882.0-2,900.0). The late May bull breakout now targets the 78.6% retracement target and March chart resistance in the 3,133.8/3,136.0 area. However, given the longer-term bearish damage inflected as highlighted above, we find it unlikely that the S&P 500 will challenge the all-time high at 3,394.9 in June (or even this year).
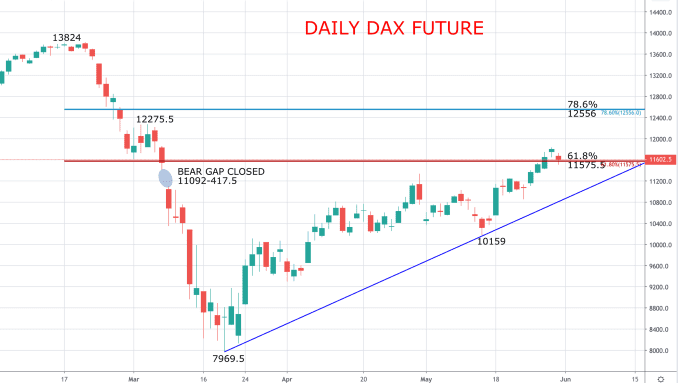
The DAX future is also above its 61.8% retracement of the February-March bear market at 11,575.5, having also closed its March runaway bear gap (11,092-417.5). The June target is also the 78.6% retracement level and March chart resistance in the 12,275.5/12,556 area. Again, as with the S&P 500, we do not anticipate a retest of the all-time high at 13,824 in June (or in 2020).

The Nikkei future left behind the 61.8% retrace of the December 2019-March 2020 bear market at 20,880 and is already homing in on the 78.6% retracement target at 23,310, having also closed its March bear gap (20,150-215). The initial June target is 23,310, but unlike the aforementioned markets, we do see a threat for the Nikkei 225 to try for a retest of the March cycle high at 24,140 in June.
Given that the threat into June is for further upside, what does this mean for the bigger picture for global stock indexes? This is the question being asked of global strategists right now.
From our technical perspective, although the short-term outlook into June remains for further upside, we do not see most of the major benchmarks challenging the current 2020 cycle highs.
Given that markets remain contained below the peaks from the first quarter of 2020 at the end of the second quarter and taking into consideration the above-mentioned damage inflicted to the long-term charts, the threat in the next two quarters is for a roll back down lower into the very wide ranges established by the first-quarter sell-offs.
From a macroeconomic perspective, a more negative outlook could be driven by the lifting of lockdowns allowing for the removal of fiscal accommodation by governments, which could expose the stark reality of a post-pandemic global economy, damaged by the measures taken during global lockdowns.
Furthermore, there is also the risk of a second wave of coronavirus cases and deaths as lockdowns are eased, potentially seeing lockdown measures reinstated. Finally, the growing resumption of tensions between China the U.S. (as well as other nations), could lead to a renewal of the 2019 trade war.
With most commentators agreeing that the economic recovery is likely to be U-shaped at best or even L-shaped at worst, the likelihood of a V-shaped recovery by the global economy seems unlikely, which is likely going to be needed to continue the aggressive V-shaped rebound in stock indexes.
